又捡起buildroot了。
近期在做buildroot编译优化,阅读buildroot manual时发现个有意思的东西graph-build,准备实操下。
graph-build官方说明
When the build of a system takes a long time, it is sometimes useful to be able to understand which packages are the longest to build, to see if anything can be done to speed up the build. In order to help such build time analysis, Buildroot collects the build time of each step of each package, and allows to generate graphs from this data.
To generate the build time graph after a build, run:
1 | make graph-build |
This will generate a set of files in output/graphs :
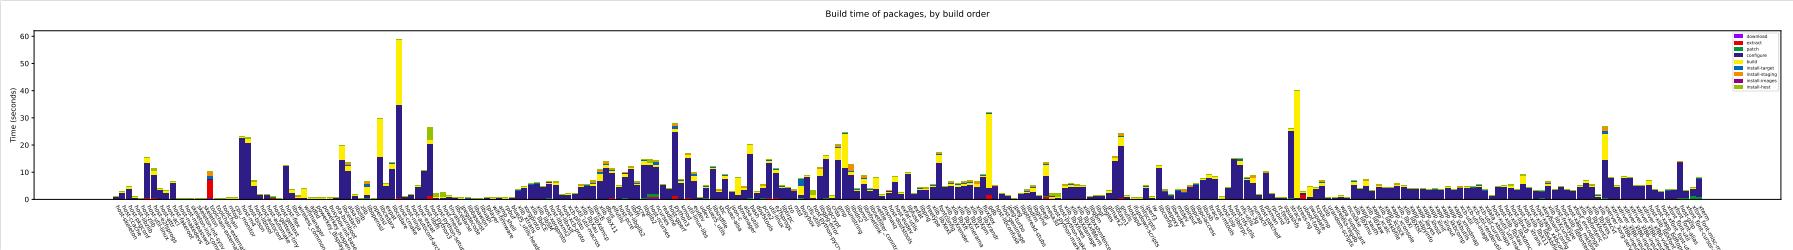
build.hist-build.pdf, a histogram of the build time for each package, ordered in the build order.
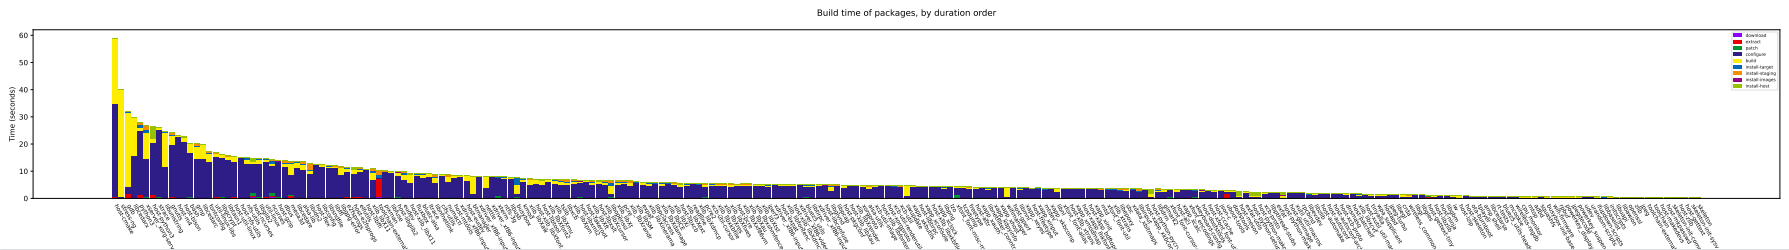
build.hist-duration.pdf, a histogram of the build time for each package, ordered by duration (longest first)
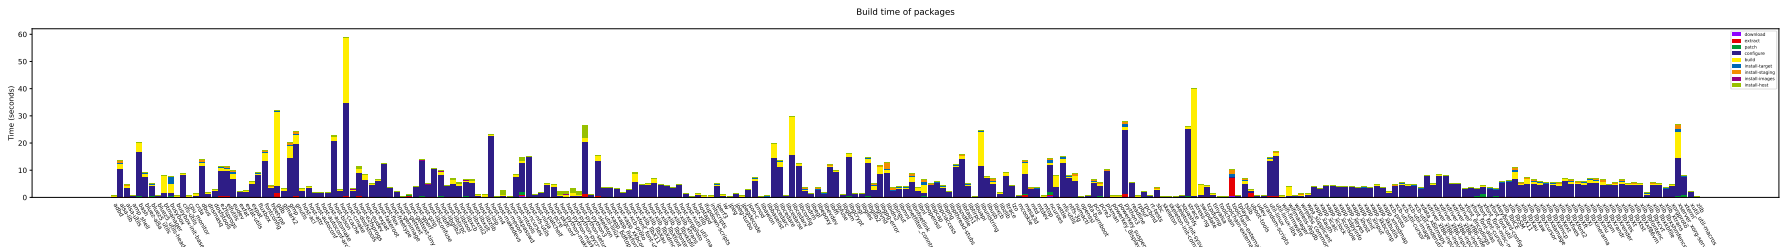
build.hist-name.pdf, a histogram of the build time for each package, order by package name.
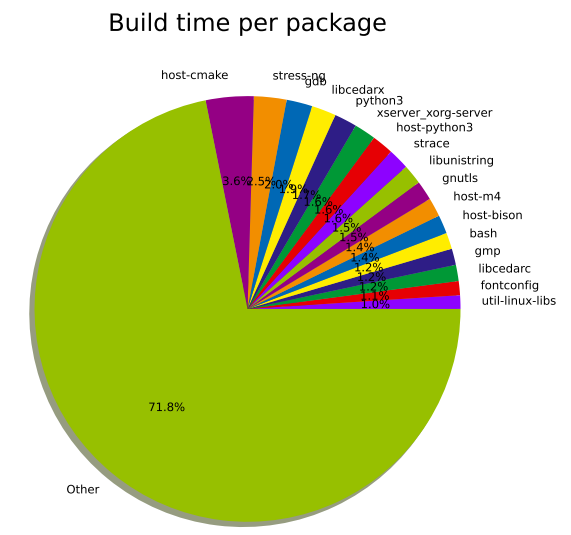
build.pie-packages.pdf, a pie chart of the build time per package
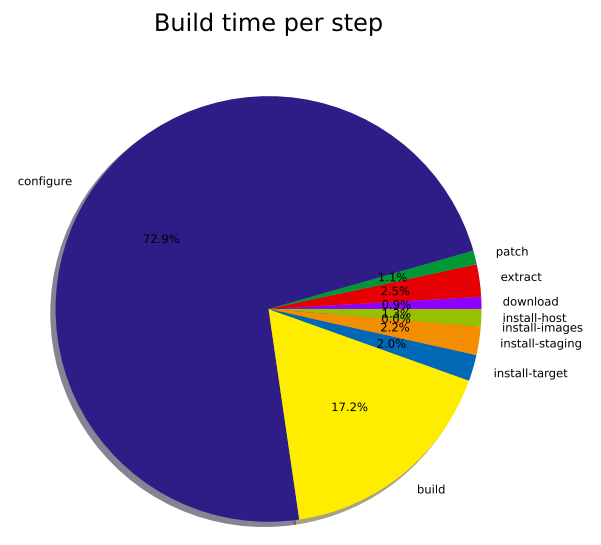
build.pie-steps.pdf, a pie chart of the global time spent in each step of the packages build process.
This graph-build target requires the Python Matplotlib and Numpy libraries to be installed (python-matplotlib and python-numpy on most distributions), and also the argparse module if you’re using a Python version older than 2.7 (python-argparse on most distributions).
By default, the output format for the graph is PDF, but a different format can be selected using the BR2_GRAPH_OUT environment variable. The only other format supported is PNG:
1 | BR2_GRAPH_OUT=png make graph-build |
简单来说,在构建完成buildroot之后,可以运行make graph-build生成一系列的编译过程中耗时图,主要有:
- build.hist-build.pdf:按构建顺序排序的每个软件包构建时间的直方图。
- build.hist-duration.pdf:按持续时间排序(从最长开始)的每个软件包构建时间的直方图。
- build.hist-name.pdf:按软件包名称排序的每个软件包构建时间的直方图。
- build.pie-packages.pdf:每个软件包构建时间的饼图。
- build.pie-steps.pdf:每个软件包构建过程中各步骤所占总时间的饼图。
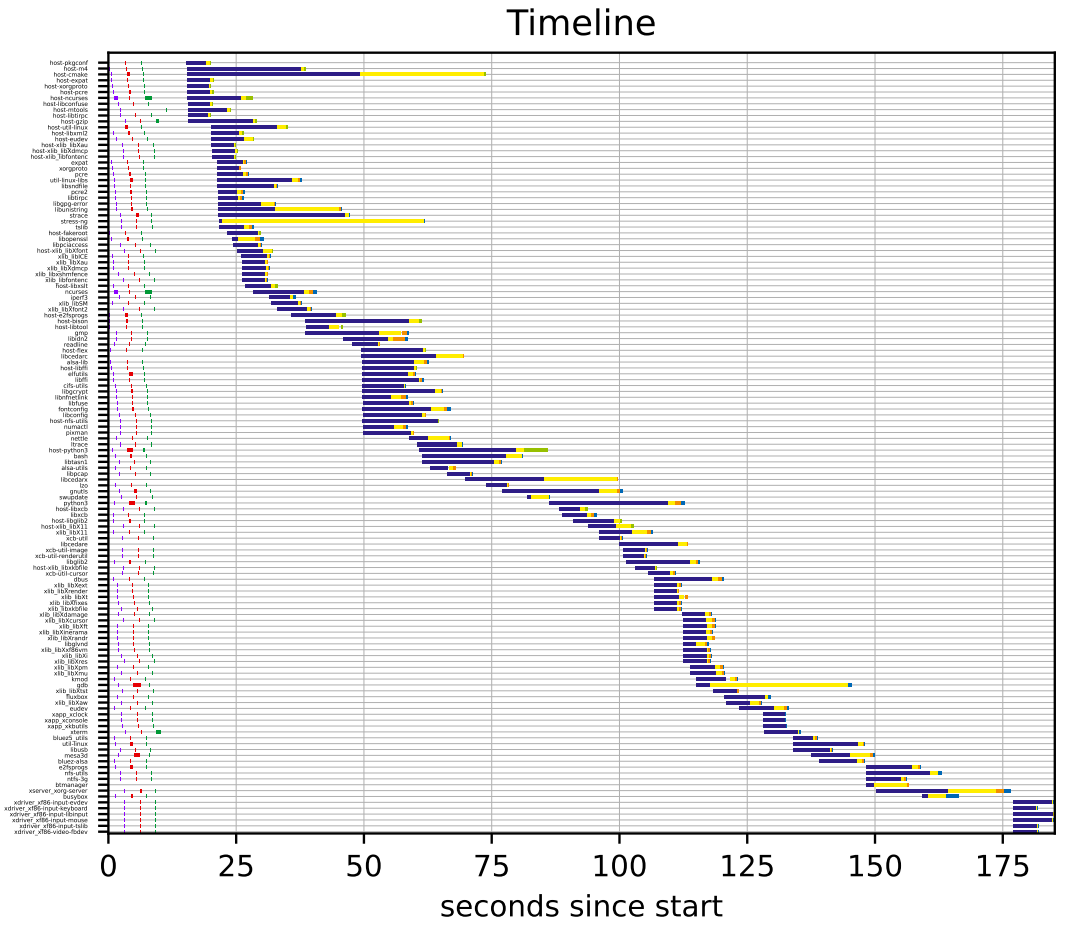
在实际运行时,还存在timeline的图。
- build.timeline.pdf:按照编译时间顺序显示整个编译过程的甘特图。
graph-build原理
查看buildroot/Makefile文件,可以看到就是使用support/scripts/graph-build-time对$(O)/build/build-time.log文件进行解析,生成各类图片。
1 | graph-build: $(O)/build/build-time.log |
安装python3依赖
使用graph-build需要python-matplotlib、python-numpy等python包。由于服务器是离线环境,这里提供一种whl的安装方式。
正常可以到python官网下载,这里使用清华源。
- 进入https://pypi.tuna.tsinghua.edu.cn/simple/kiwisolver/ ,将其中的kiwisolver换成对应的包名,并下载对应版本。
- 下载后whl后,使用pip3 install xxx.whl进行安装,默认安装到~/.local/bin下。
- 在
/.bashrc中将/.local/bin在加入到PATH环境变量中,执行source ~/.bashrc生效。
1 | PATH=$PATH:/home/xxx/.local/bin |
graph-build输出
hist
hist会列出每个包各个阶段的耗时,主要用于筛选出编译耗时长的包,针对这些包进行优化。
hist-build
hist-duration
hist-name
pie
pie主要是用于统计目的。
pie-packages
pie-steps
timeline
timeline主要是用于优化编译依赖的目的。
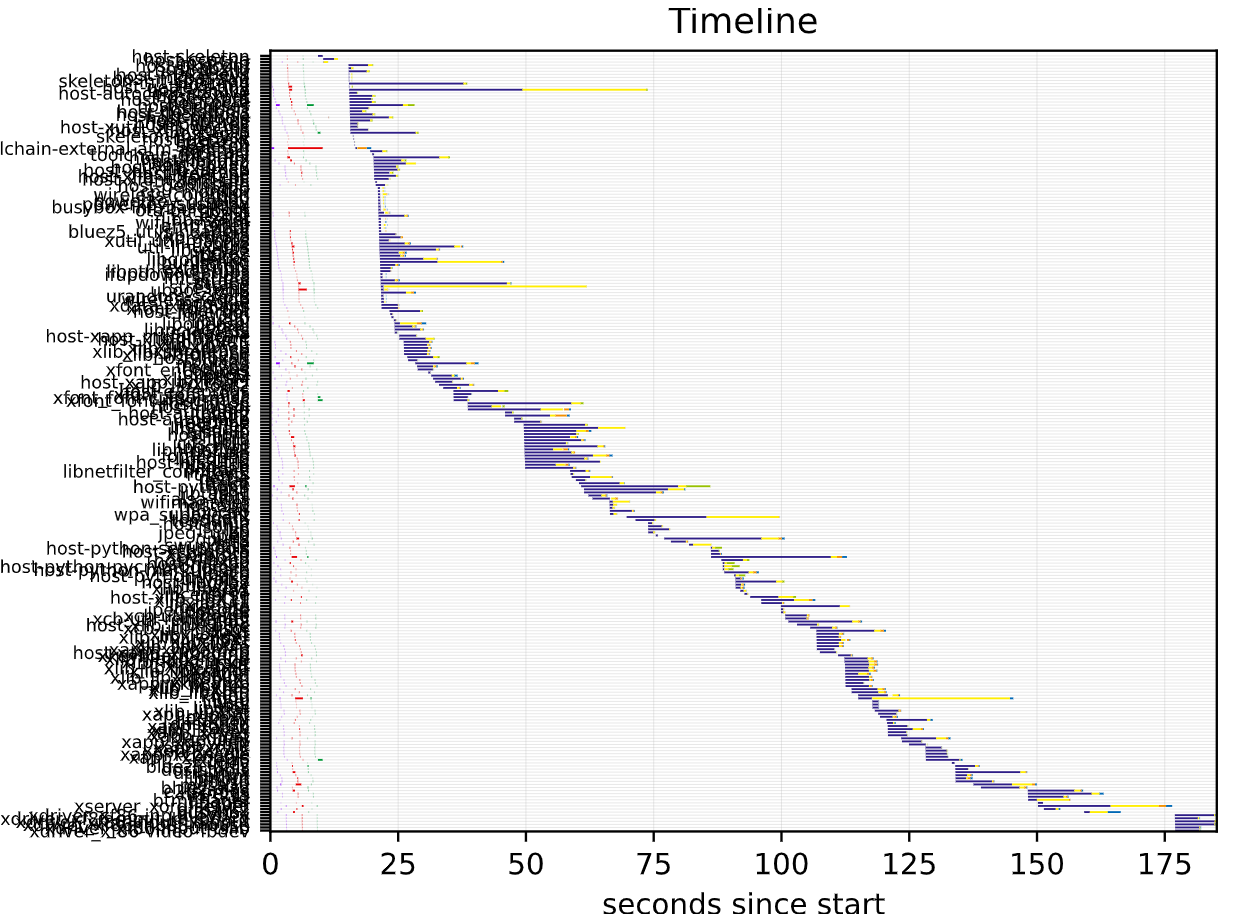
timeline输出优化
使用默认的脚本,生成的图片纵坐标label都重叠了,且很多耗时短的包都绘制了,看起来不清晰。
这里提供一个补丁,优化其输出。
1 | diff --git a/support/scripts/graph-build-time b/support/scripts/graph-build-time |