1
2
3
4
5
6
7
8
9
10
11
12
13
14
15
16
17
18
19
20
21
22
23
24
25
26
27
28
29
30
31
32
33
34
35
36
37
38
39
40
41
42
43
44
45
46
47
48
49
50
51
52
53
54
55
56
57
58
59
60
61
62
63
64
65
66
67
68
69
70
71
72
73
74
75
76
77
78
79
80
81
82
83
84
85
86
87
88
89
90
91
92
93
94
95
96
97
98
99
100
101
102
103
104
105
106
107
108
109
110
111
112
113
114
115
116
117
118
119
120
121
122
123
124
125
126
127
128
129
130
131
132
133
134
135
136
137
138
139
140
141
142
143
144
145
146
147
148
149
150
151
152
153
154
155
156
157
158
159
160
161
|
import sys
import csv
from datetime import datetime, timedelta
import matplotlib.pyplot as plt
import matplotlib.dates as mdates
import numpy as np
import matplotlib
filename = sys.argv[1]
index = sys.argv[2]
def get_xticks(min_date, max_date, delta_day):
x_ticks = []
curr_date = min_date
delta = timedelta(days=delta_day)
while curr_date <= max_date:
x_ticks.append(curr_date)
curr_date += delta
return x_ticks
def find_min_max_dates(csv_data, column_index):
dates = []
for row in csv_data:
date_str = row[column_index]
try:
date = datetime.strptime(date_str, '%Y-%m-%d').date()
dates.append(date)
except ValueError:
pass
min_date = min(dates) if dates else None
max_date = max(dates) if dates else None
return min_date, max_date
def count_dates_before_3(csv_data, column_index, min_date, max_date):
date_counts = {}
curr_date = min_date
while curr_date <= max_date:
date_counts[curr_date] = 0
curr_date += timedelta(days=1)
for row in csv_data:
date_str = row[column_index]
try:
date_obj = datetime.strptime(date_str, '%Y-%m-%d').date()
if min_date <= date_obj <= max_date:
curr_date = date_obj
while curr_date >= min_date:
date_counts[curr_date] += 1
curr_date -= timedelta(days=1)
except ValueError:
curr_date = max_date
while curr_date >= min_date:
date_counts[curr_date] += 1
curr_date -= timedelta(days=1)
pass
return date_counts
def find_children(csv_data, parent_index, c_col, p_col):
children = []
for row in csv_data:
if row[2] == parent_index:
children.append(row)
children.extend(find_children(csv_data, row[0], c_col, p_col))
return children
with open(filename, 'r') as csvfile, open(filename+".sort", 'w', newline='') as sorted_csvfile:
reader = csv.reader(csvfile)
writer = csv.writer(sorted_csvfile)
data = list(reader)
writer.writerow(data[0])
p_col = None
s_col = None
e_col = None
l_col = None
for i, cell in enumerate(data[0]):
if cell == "父任务":
p_col = i
if cell == "计划开始日期":
s_col = i
if cell == "计划完成日期":
e_col = i
if cell == "实际完成时间":
l_col = i
sorted_data = sorted(data[1:], key=lambda row: row[0])
for row in sorted_data:
if row[0] == index:
writer.writerow(row)
real_min_date = datetime.strptime(row[s_col], '%Y-%m-%d').date()
child_data = find_children(sorted_data, index, 0, p_col)
for child in child_data:
writer.writerow(child)
min_date, max_date = find_min_max_dates(child_data, e_col)
date_now = datetime.now().date()
date_counts_orig = count_dates_before_3(child_data, e_col, real_min_date, max_date)
real_date_counts_orig = count_dates_before_3(child_data, l_col, real_min_date, max_date)
date_counts = {k: v for k, v in date_counts_orig.items() if k < date_now}
real_date_counts = {k: v for k, v in real_date_counts_orig.items() if k < date_now}
matplotlib.rcParams['font.sans-serif'] = ['SimHei']
matplotlib.rcParams['axes.unicode_minus'] = False
plt.figure(figsize=(15, 6))
x = list(date_counts.keys())
y = list(date_counts.values())
x1 = list(real_date_counts.keys())
y1 = list(real_date_counts.values())
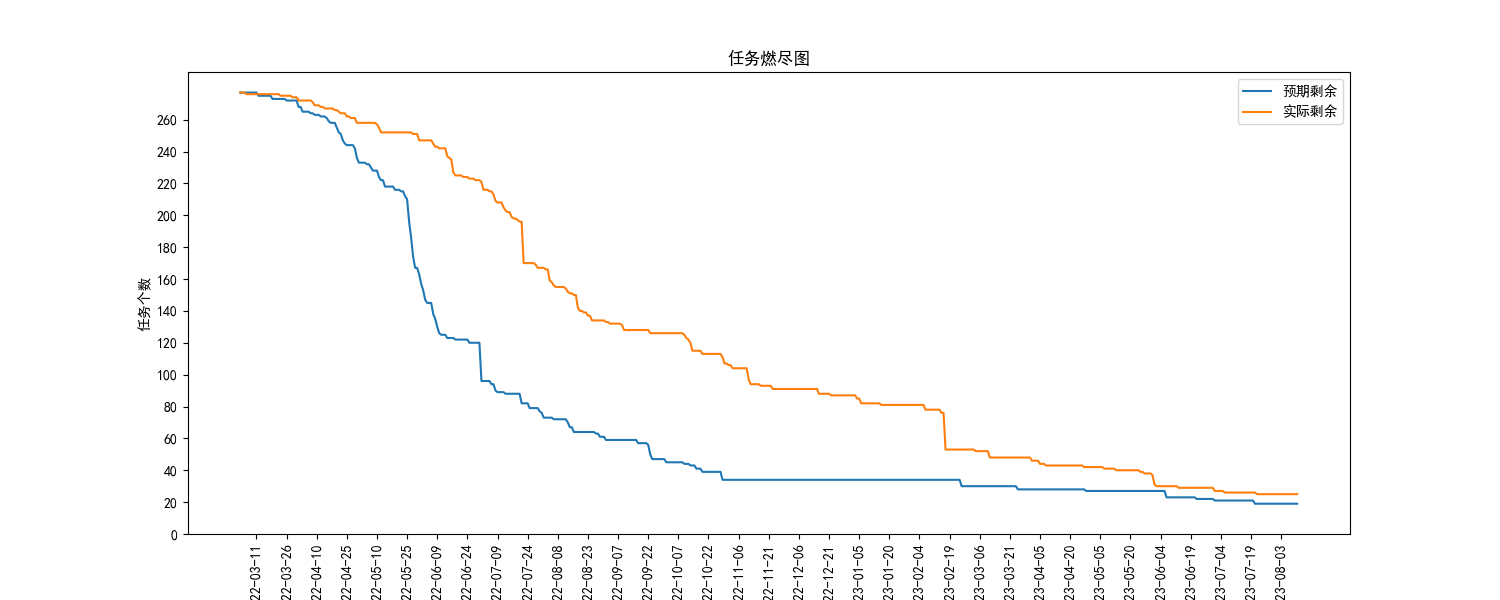
plt.plot(x, y, label='预期剩余')
plt.plot(x1, y1, label='实际剩余')
plt.xlabel('日期')
plt.ylabel('任务个数')
plt.title('任务燃尽图')
x_ticks = get_xticks(min_date, date_now, 15)
num_list = mdates.date2num(x_ticks)
plt.xticks(num_list, [date.strftime('%Y-%m-%d') for date in x_ticks])
y_ticks = np.arange(0, 280, 20)
plt.yticks(y_ticks)
plt.xticks(rotation=90)
plt.legend()
plt.show()
|